


What an anomaly detection system includes
Aranv builds AI anomaly detection for finance, operations and data teams: models that learn the normal pattern of your daily orders, payments, journal entries, data loads and meter readings, flag what breaks it, and send each alert with context to the person who owns that number in Slack, Teams, email or a ticket queue.
Every business has numbers that should behave predictably: daily orders, payroll totals, invoice amounts, meter readings, the rows in last night’s data load. AI anomaly detection learns the normal pattern of each one, including weekly and seasonal swings, and flags the points that do not fit. It earns its keep when there are too many series to watch by eye.
An anomaly is not always a problem, and the model cannot know which ones matter. That judgment stays with people, so we design the review step first: who gets the alert, what context comes with it and where the decision is recorded. For payment and order risk, see fraud detection; for machines, predictive maintenance.
From problems found at month end to alerts the same day
How an anomaly becomes an alert
- 01 Learn the normal pattern Each series is modeled with its weekday, seasonal and holiday swings.
- 02 Score new data Fresh readings, transactions or loads are compared with what was expected.
- 03 Group and rank Related outliers are merged and ranked by business impact before anyone sees them.
- 04 Owner reviews and marks The owner marks each alert as expected or real, and thresholds adjust.
Known events, such as holidays, price changes and planned outages, are entered so they do not trigger alerts.
Where we apply anomaly detection
Any number that should behave predictably can be watched, but we start where a missed problem costs the most.
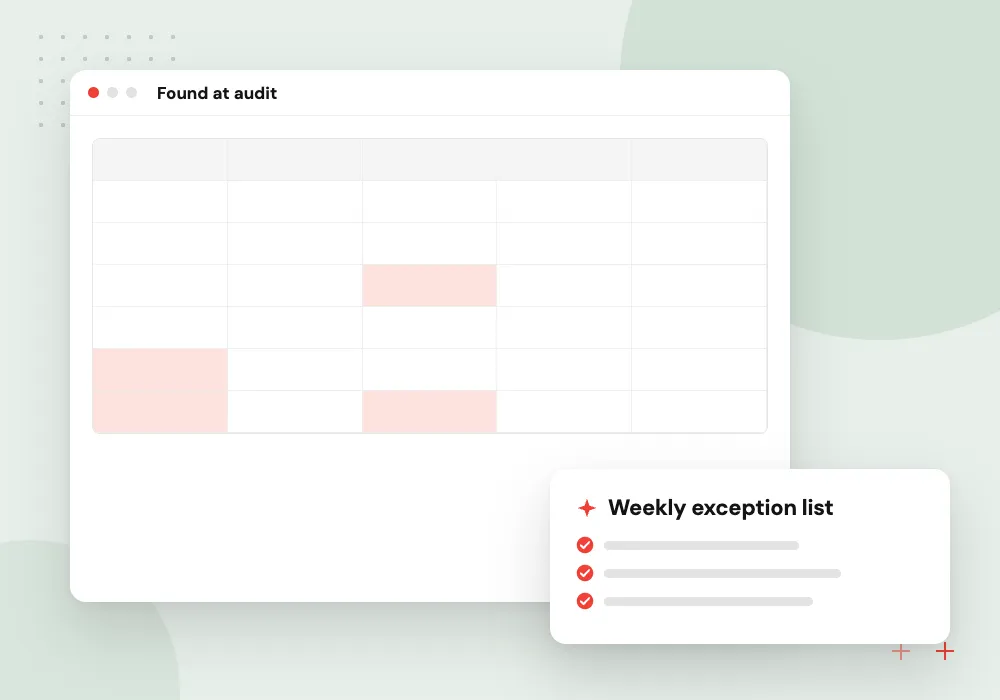
Finance and payment outliers
Duplicate invoices, odd round-number payments, journal entries posted at unusual hours and expense claims far outside a person’s norm flagged for the controller.
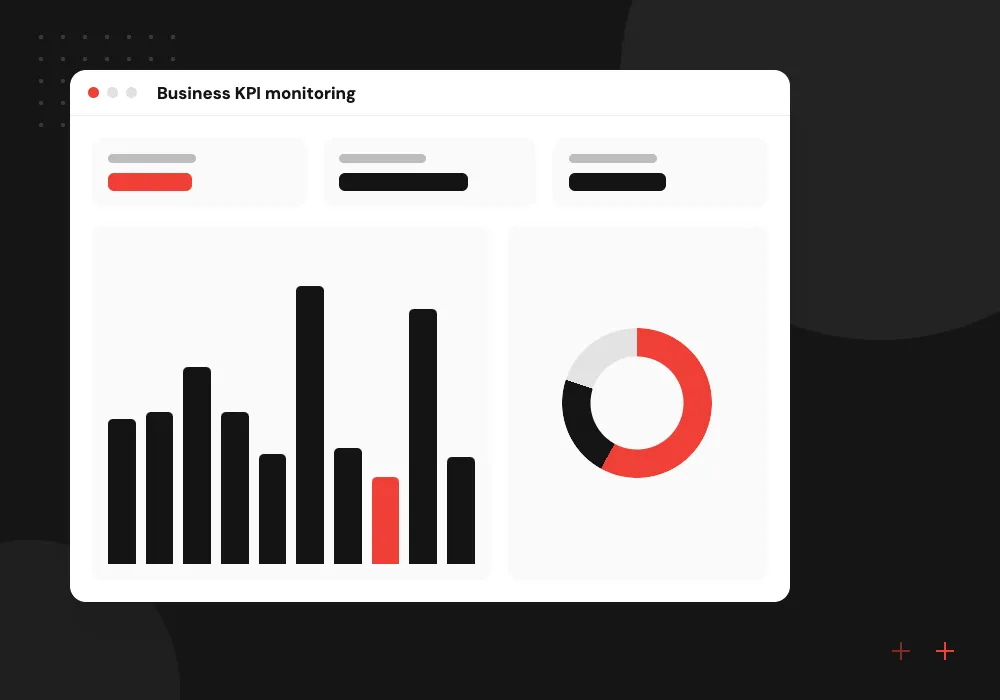
Business KPI monitoring
Orders, sign-ups, conversion and call volume watched against the expected level for that hour and weekday, so a broken checkout or form gets noticed fast.
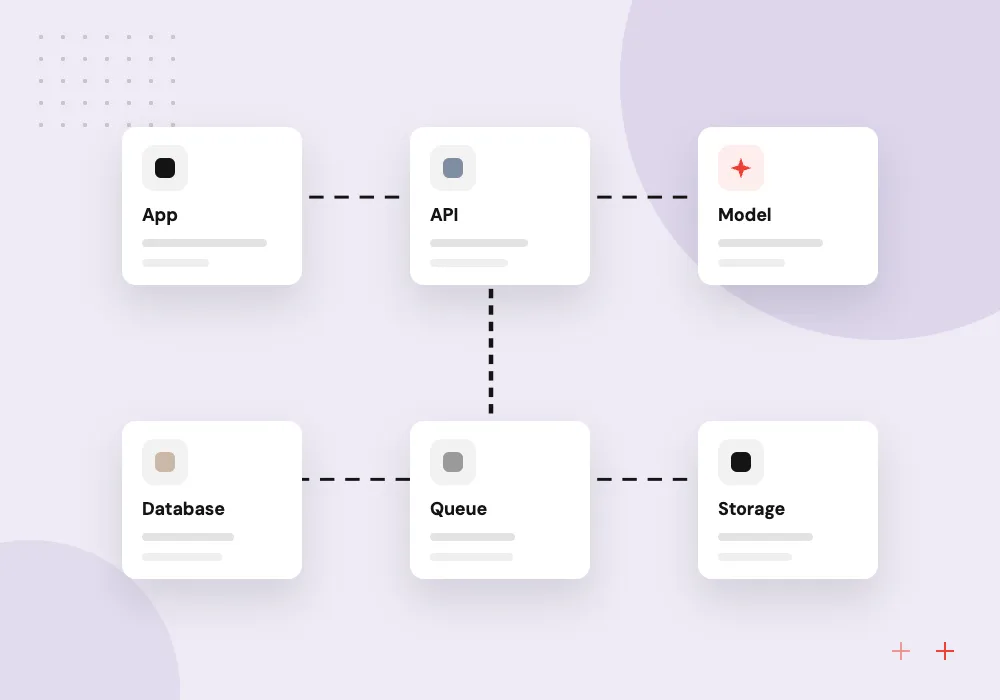
Data pipeline checks
Row counts, missing values and shifted distributions in nightly loads caught before a report, invoice run or model uses bad data.
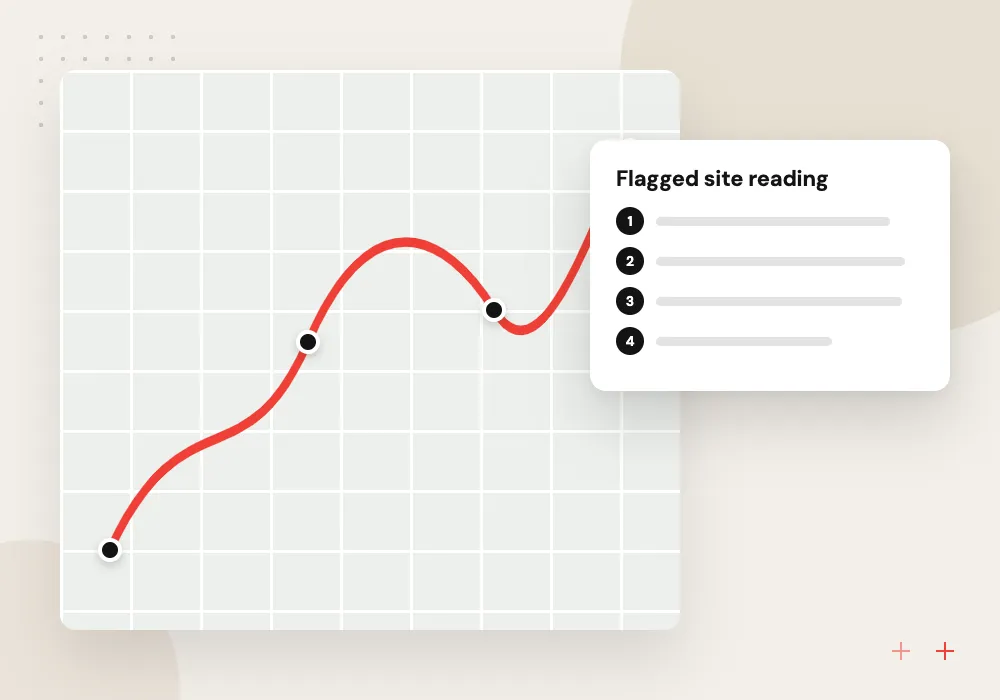
Meter and sensor outliers
Energy, water or temperature readings that break from a site’s usual profile flagged, separating faulty sensors from real changes in use.
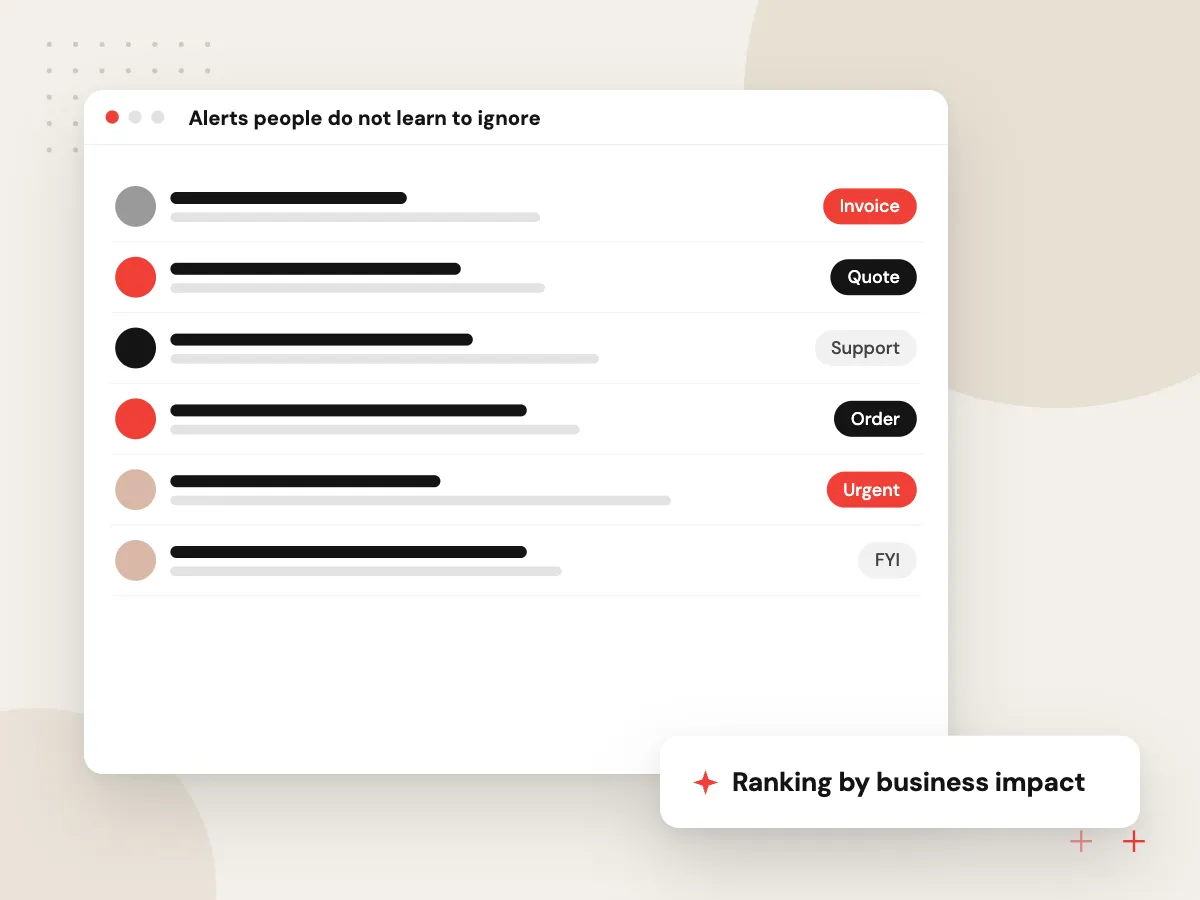
Alerts people do not learn to ignore
An anomaly detection system that cries wolf gets muted within weeks. We group related alerts, rank them by business impact, silence known events such as holidays and planned outages, and let each owner mark an alert as expected or real. Those marks tune thresholds over time.
What we do
- Ranking by business impact
- Grouping of related alerts
- Calendar of known events
- Expected or real feedback button
- Alerts to Slack, Teams or email
Choosing the right method for your data
Outlier detection is a family of methods, not one model. Seasonal baselines suit daily KPIs, isolation forests suit wide tables of transactions, and autoencoders suit dense sensor streams. We test several on your history, using known past incidents to see what each would have caught.
What we do
- Seasonal baselines for KPIs
- Isolation forests for transactions
- Autoencoders for sensor streams
- Backtests on known incidents
- Documented thresholds and owners
How we approach a project
Detectors come from our machine learning development team, often starting with open-source tools such as scikit-learn, and run on pipelines built by our data engineering team. Accounting firms and utilities are frequent users; see accounting firms and energy and utilities.
Pick one number you wish you had watched more closely last year. Its history is enough for a first sketch of a detector, drawn up together in a 30-minute conversation; the contact page shows open times.
How we work
- Design the review step first
- Fewer alerts, each with context
- Feedback tunes every threshold
Our Process
-

List the numbers and owners
We choose the series worth watching and name the person who acts when each one goes wrong.
-

Collect past incidents
Known problems from the last year or two, such as outages or billing errors, become the test set for every method.
-

Backtest several methods
Seasonal baselines, isolation forests and other detectors run on history, and we compare what each would have caught and missed.
-

Go live with feedback
Alerts start for a few series, owners mark each one, and thresholds and grouping rules are tuned from their answers.
Why Aranv for anomaly detection
An owner for every alert
No series goes live without a named person who receives its alerts and decides what they mean, so nothing lands in a shared inbox and waits.
Tested on your past incidents
Methods are judged on problems you already know happened, so you see what would have been caught, and how early, before trusting new alerts.
Context travels with the alert
Each alert shows the expected range, the actual value, related series and recent changes, so the owner can judge it in a minute rather than an hour.
Alert volume kept in check
We agree how many alerts each owner can handle and tune to that budget, retiring checks that nobody acts on.
Planning AI Anomaly Detection?
Book a 30-minute conversation with the team that would build it.
AI anomaly detection FAQs
-
What is the difference between anomaly detection and fraud detection?
Anomaly detection flags anything unusual, whether it is fraud, an error, a broken feed or a real change in demand. Fraud detection is narrower: it learns from confirmed fraud cases and scores how likely an event is to be fraudulent. Many teams start with anomalies and add a fraud model once labeled cases build up.
-
Do we need labeled examples of problems?
Not to start. Most methods learn normal behavior from unlabeled history and flag what departs from it. Past incidents are still valuable, because they let us test whether a method would have caught problems you already know about before we trust it on new ones.
-
How do you prevent too many false alarms?
By grouping related alerts, ranking them by business impact, entering known events such as holidays, and letting owners mark alerts as expected. We also agree an alert budget per owner, so thresholds are set to a volume people will actually read.
-
Can an anomaly detection system run in real time?
Yes, where the data arrives in real time, such as payments, web events or sensor streams. Many finance and reporting checks run perfectly well hourly or nightly. We match the schedule to how quickly someone can act on the alert.
-
What happens to outlier detection after launch?
Normal patterns shift as the business grows, so models are retrained on a schedule and thresholds are reviewed with owners each month. New series can be added as needed, and alerts nobody acts on are retired.

Let’s talk about your next step
Contact Aranv to discuss your workflow, current tools, and goals. Meet with our team or send an inquiry.
Book a meeting with our team
Choose an available date and time for a 30-minute conversation about your project.
Tell us about your project
Share a few details so we can discuss a useful next step.
Prefer email? sales@aranv.com