


What predictive analytics services include
Aranv delivers predictive analytics services for small and midsize US companies that still plan from last year’s spreadsheet. We build forecasting models and risk scores from your sales, operations and finance records, explain what drives each prediction, and place the results in the reports and planning meetings where decisions are made.
Predictive analytics uses past records to estimate what is likely to happen next: next month’s orders, which invoices will be paid late, how many calls arrive on Monday morning. Our machine learning development team builds the models; this service wraps them in the data work, reporting and planning routine that make them useful.
Data usually sits in several places. We join ERP, CRM, accounting and spreadsheet records into one modeled table, often with our data engineering team, and refresh it on a schedule so forecasts never depend on a stale export.
How a forecast earns a place in planning
From records to a planning number
- 01 Pick one decision Reorder quantities, staffing levels or cash timing: a choice made often enough to test.
- 02 Assemble the history Records from your ERP, CRM, accounting and spreadsheets joined into one clean table.
- 03 Backtest the forecast We forecast past months the model never saw and compare with what happened.
- 04 Put it in the meeting Forecasts and ranges appear in the report your managers already review each week.
A forecast nobody uses in a decision is only a cost, so we start from the decision rather than the data.
Predictive modeling for planning and risk
Predictive analytics suits questions that come back every week or month, where past records hold a usable pattern.
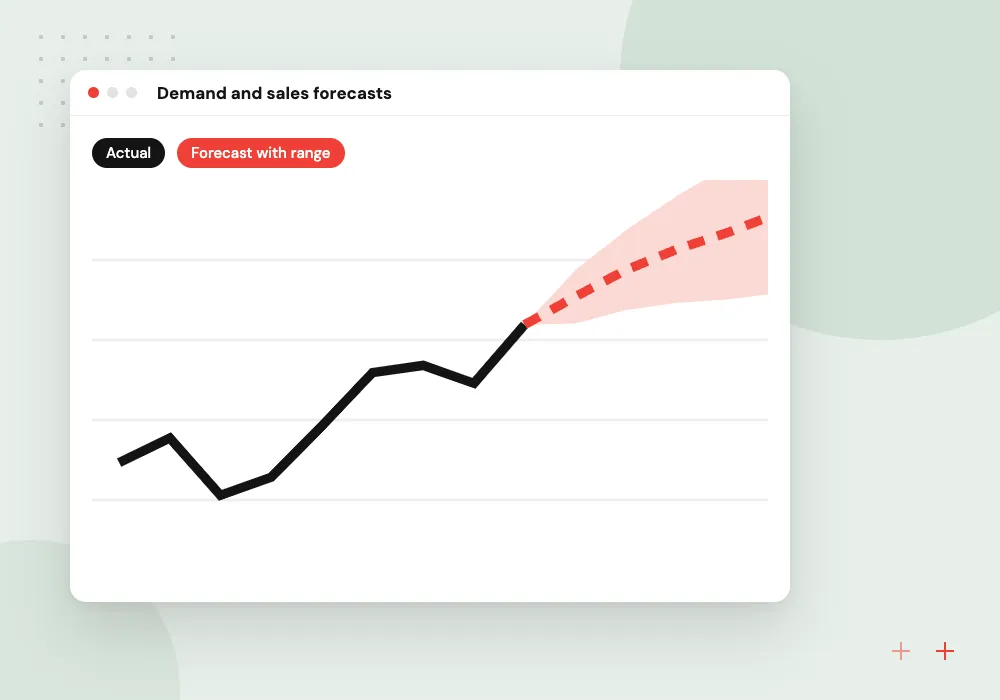
Demand and sales forecasts
Expected units or revenue by product, region or channel, with a range that shows how sure the forecast is.
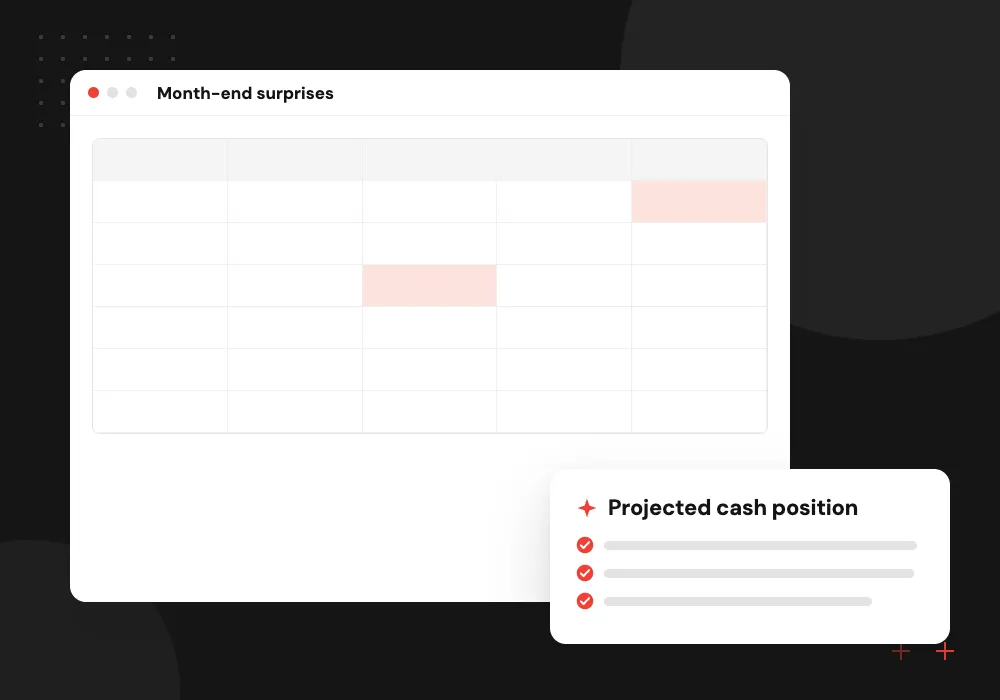
Cash flow projections
Incoming payments predicted from invoice age, each customer’s payment habits and seasonality, so finance sees shortfalls weeks ahead.
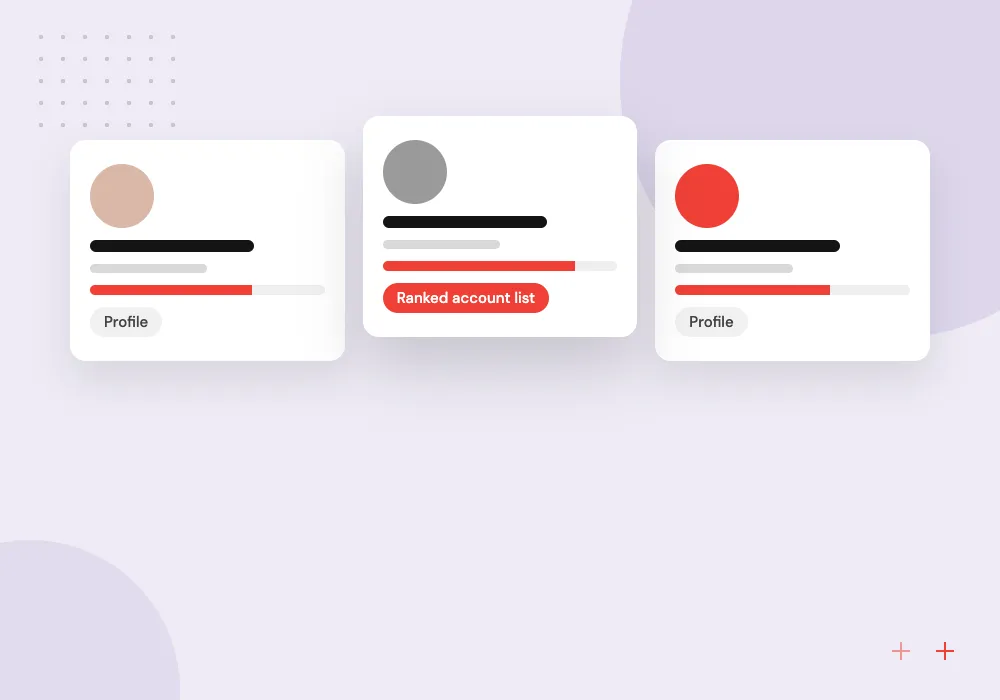
Customer risk scores
Accounts ranked by likelihood of leaving, paying late or upgrading, using order frequency, support history and renewal dates.
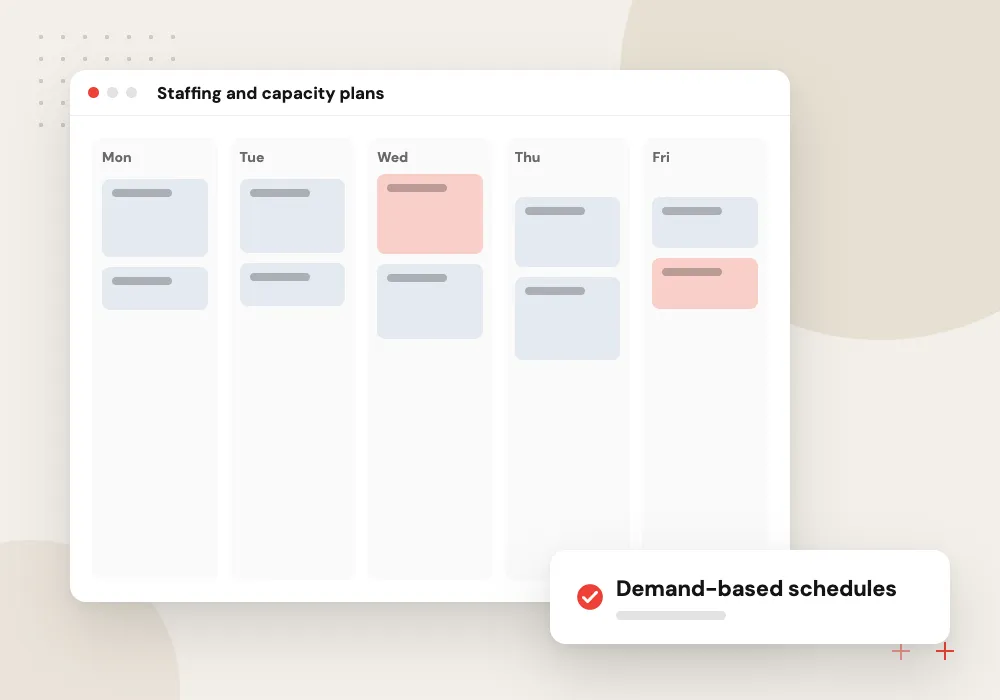
Staffing and capacity plans
Call volume, job bookings or warehouse throughput forecast by day and hour, so rosters match the expected workload.
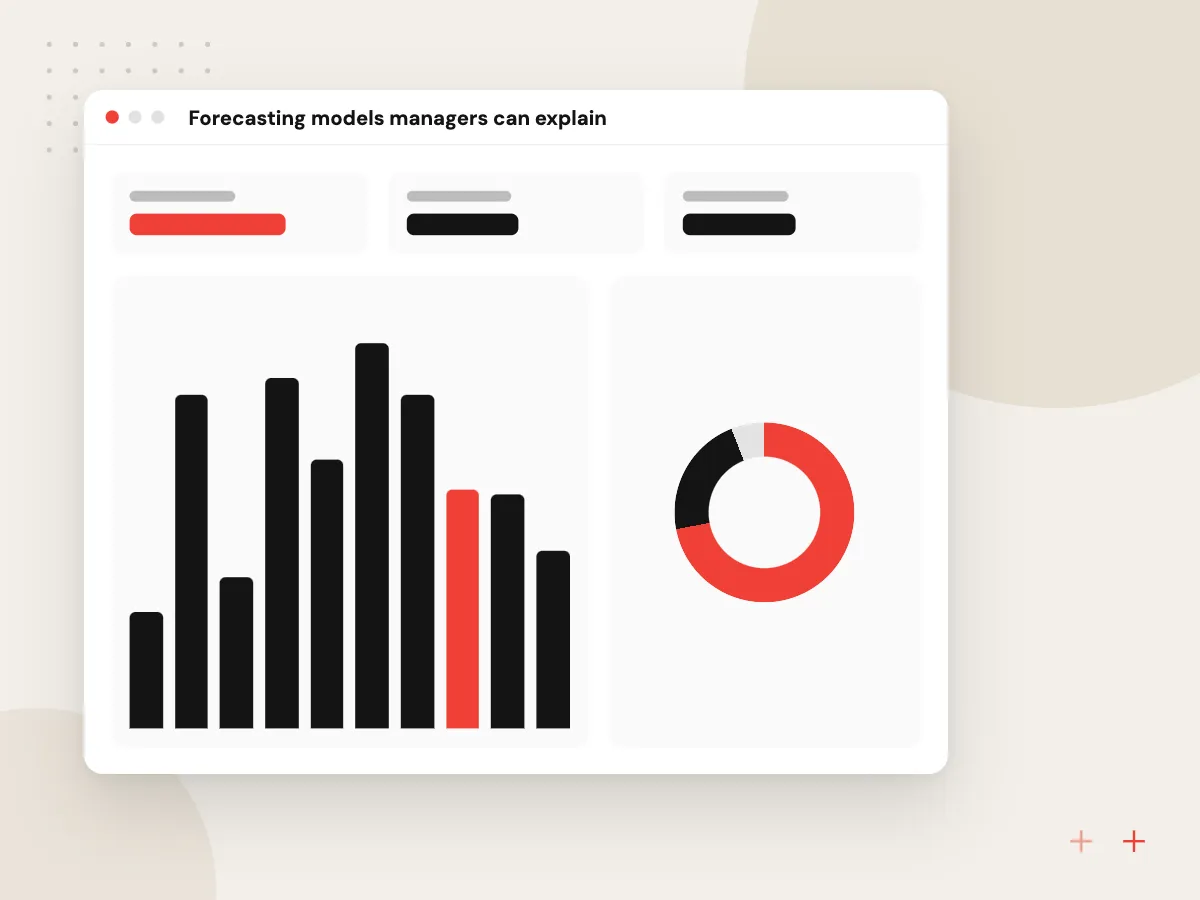
Forecasting models managers can explain
People act on forecasts they understand. We use methods suited to your data, from seasonal time-series models to gradient-boosted trees, and show which inputs moved each prediction, such as a promotion, a price change or a large customer’s ordering pattern. Every forecast carries a range rather than a single point.
What we do
- Backtests on past periods
- Prediction ranges and confidence bands
- Driver breakdown for each forecast
- Comparison with your current method
- Scheduled retraining on new data
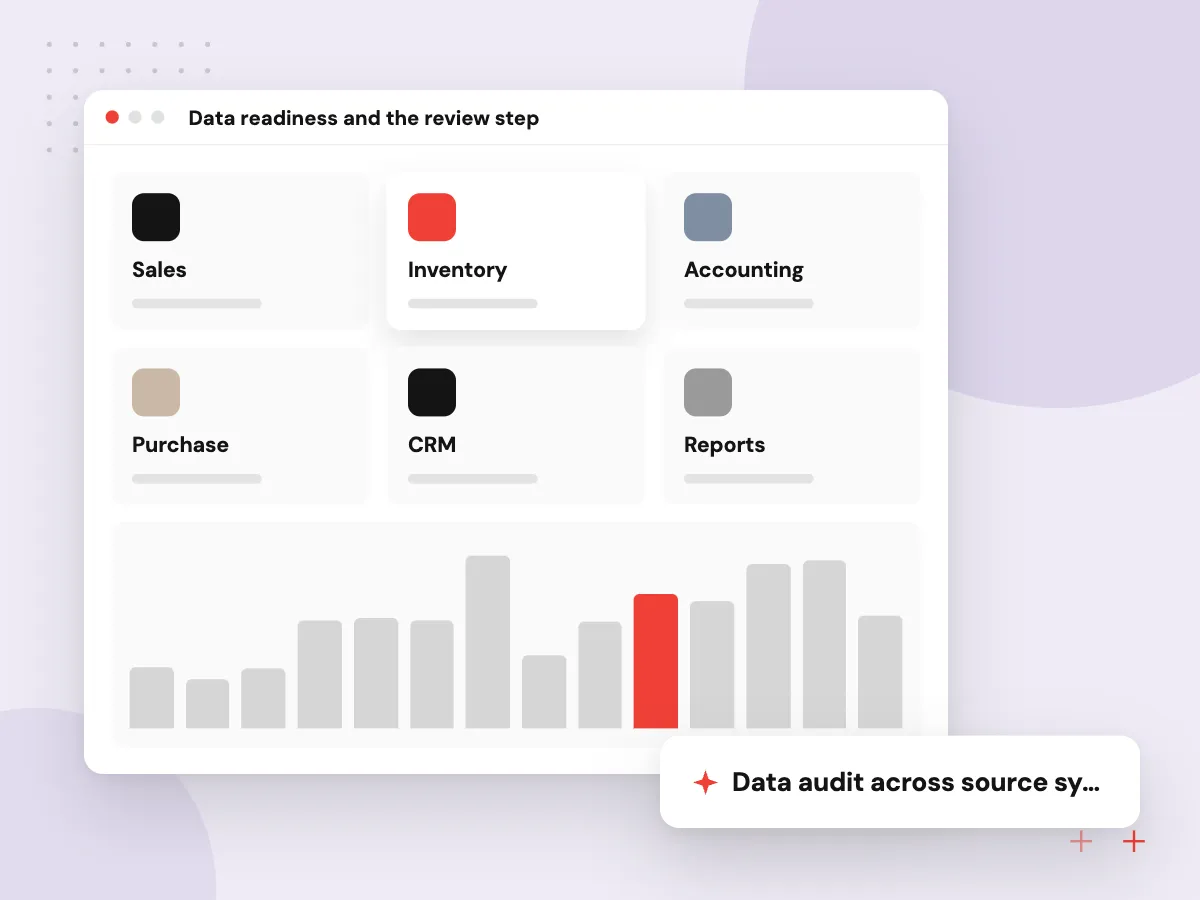
Data readiness and the review step
Predictions are only as good as the records behind them. We check how far back your history goes, where it has gaps, and whether the result you care about was ever logged. A named person on your side reviews each forecast cycle before it reaches planning and can override it with a note.
What we do
- Data audit across source systems
- Gap and outlier report
- Feature table refreshed on schedule
- Overrides recorded with a reason
- Accuracy tracked against actuals
How we approach a project
Results appear where managers already look, such as Power BI reports, an ERP screen or a weekly email. A language model can add a short written note on what changed since last week, generated from the figures and checked against them. For specific jobs, see AI demand forecasting and churn prediction.
Unsure whether your history is long or clean enough? Bring one recurring decision to a 30-minute conversation, scheduled through our contact page, and we will outline the data a first forecast would need.
How we work
- Start from a recurring decision
- Show ranges, not single numbers
- Backtest before anyone relies on it
Our Process
-

Decision and metric
We agree the decision the forecast supports, its horizon, and how accuracy will be judged against today’s method.
-

Data audit and joining
Source systems are reviewed for history, gaps and definitions, then combined into a refreshed modeling table.
-

Model and backtest
Several forecasting models are compared on past periods, and the simplest one that beats your current method is kept.
-

Report, review, retrain
Forecasts go into your reports with ranges, a named reviewer signs off each cycle, and the model is retrained as data grows.
Why Aranv for predictive analytics
Decision first, model second
We begin with the planning decision and the person who makes it, so the forecast’s horizon, detail and timing match how that decision is really made.
Plain backtest results
Every model is tested against your current method on past periods, and the results are shown to you plainly, including the months where it missed.
Numbers inside your reports
Forecasts are delivered into Power BI, your ERP or a scheduled email rather than a separate tool, so they become part of the weekly routine.
A person signs off
A named reviewer on your team approves each forecast cycle and can override it, with the reason stored for the next model review.
Planning Predictive Analytics?
Book a 30-minute conversation with the team that would build it.
Predictive analytics FAQs
-
What is the difference between predictive analytics and business intelligence?
Business intelligence reports what already happened, such as last quarter’s sales by region. Predictive analytics estimates what is likely to happen next from patterns in that same history. Most companies need reliable BI first, because forecasts depend on clean, agreed definitions of the numbers.
-
How much historical data do forecasting models need?
For weekly or monthly patterns, two or more years of history usually reveals seasonality, though this varies by business. Shorter histories can still support simpler models or risk scores. The data audit tells you which forecasts your records can support today.
-
Can you promise a level of forecast accuracy?
Not before testing your data. We backtest on past periods, compare the result with your current method and show you both side by side. If the model does not beat what you do today, we say so and change the approach or stop.
-
Can predictive models use outside data like weather or holidays?
Yes, when it improves the backtest. Public holiday calendars, weather records, local events and economic indicators are common inputs. We add each one only if it measurably improves accuracy on past periods, because every extra feed is something to maintain.
-
Do we need a data warehouse first?
Not always. A first forecast can run on a scheduled extract from your ERP and CRM. If several teams will use predictions, or data comes from many systems, a small warehouse becomes worth the effort and we can set one up alongside the model.

Let’s talk about your next step
Contact Aranv to discuss your workflow, current tools, and goals. Meet with our team or send an inquiry.
Book a meeting with our team
Choose an available date and time for a 30-minute conversation about your project.
Tell us about your project
Share a few details so we can discuss a useful next step.
Prefer email? sales@aranv.com