


What LLMOps services cover
Aranv provides LLMOps services for teams running language model features in production. We add tracing to every model call, score answer quality on live traffic, track cost and latency, version prompts and models, and set up alerts and release checks that catch problems before customers report them.
LLMOps is the operating side of LLM integration: what happens after the feature ships. We instrument your app with tracing, often through OpenTelemetry so traces land in the monitoring tools you already run, or in a dedicated LLM observability tool when non-engineers need to review conversations.
Quality monitoring reuses the test sets from LLM evaluation. Automatic checks run on every response, a sample goes to a reviewer each week, and corrected cases become new tests. Changes made through prompt engineering pass the same suite before release.
Running LLM features after launch
See every call, change with care
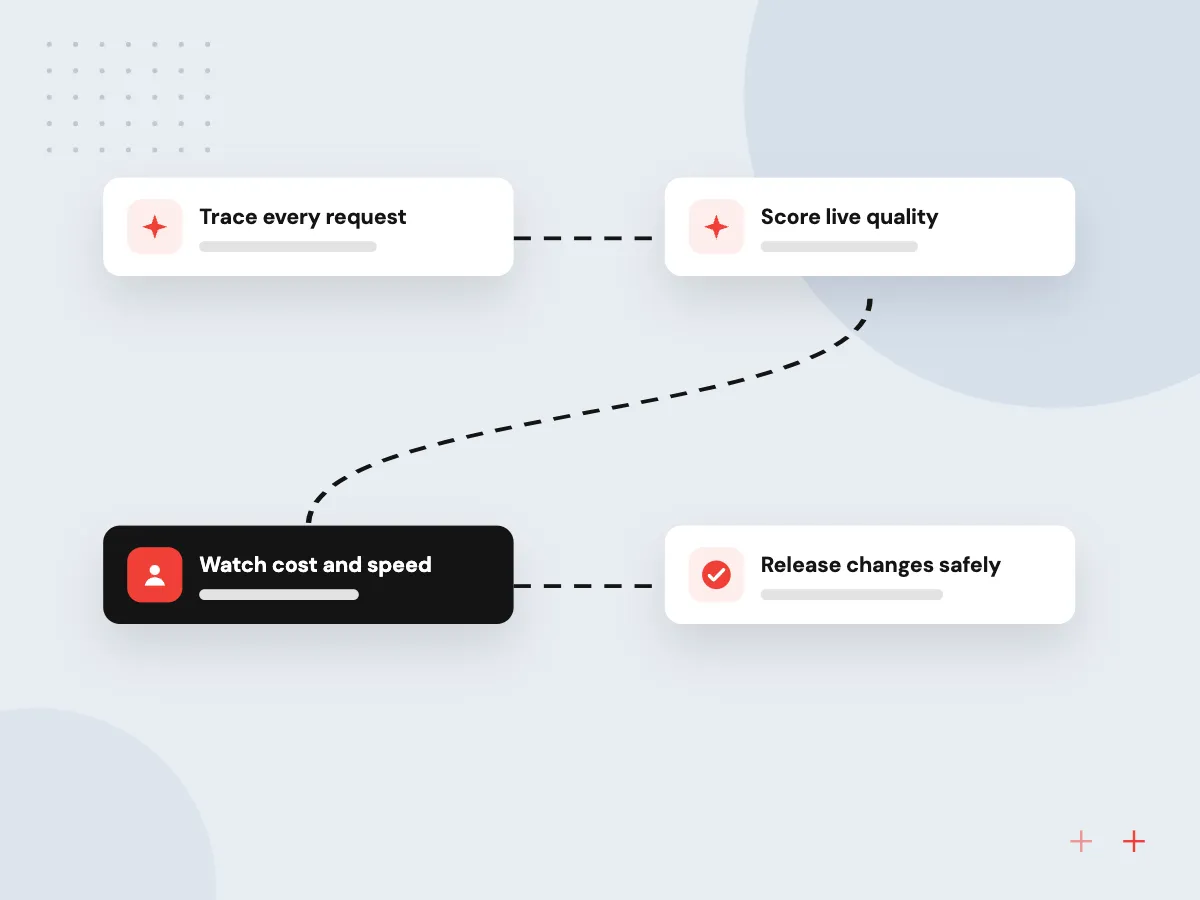
- 01 Trace every request Prompt, retrieved context, tool calls, output, tokens and latency stored per request.
- 02 Score live quality Automatic checks and sampled human review rate answers on real traffic.
- 03 Watch cost and speed Dashboards and alerts by feature, customer and model version.
- 04 Release changes safely Prompt and model changes pass a test suite, then roll out gradually.
LLM failures are often quiet. A wrong answer still returns a success code, so normal uptime checks miss it.
LLM monitoring and observability we set up
Many teams launch an LLM feature with logs that show errors but not whether the answers were any good.
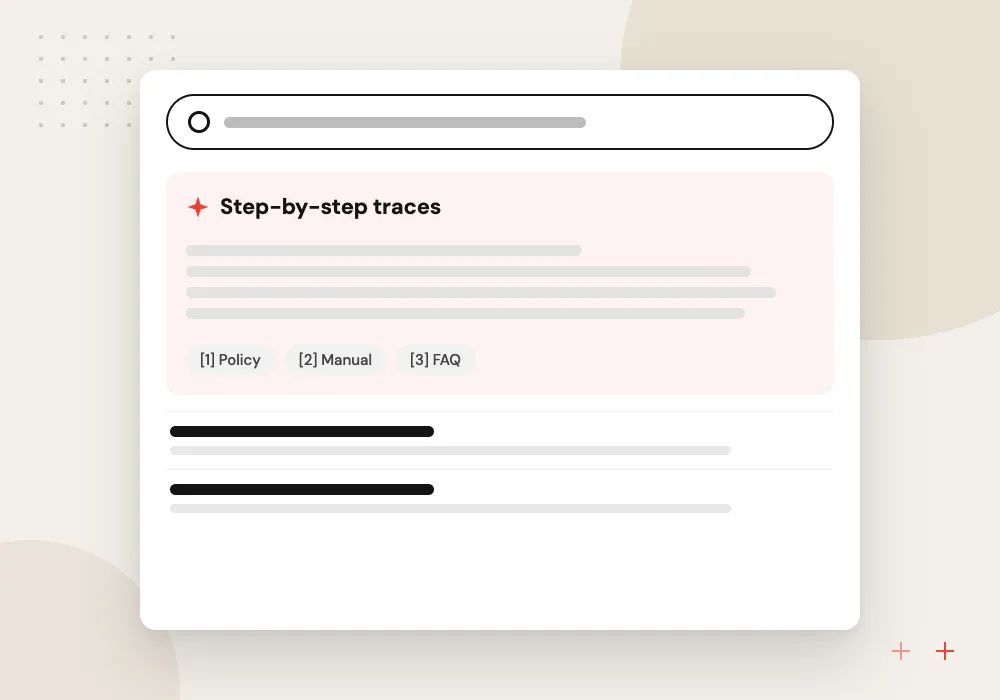
Request tracing
Each conversation or agent run recorded as a trace of steps, so an engineer can see which retrieved passage or tool call produced a bad answer.
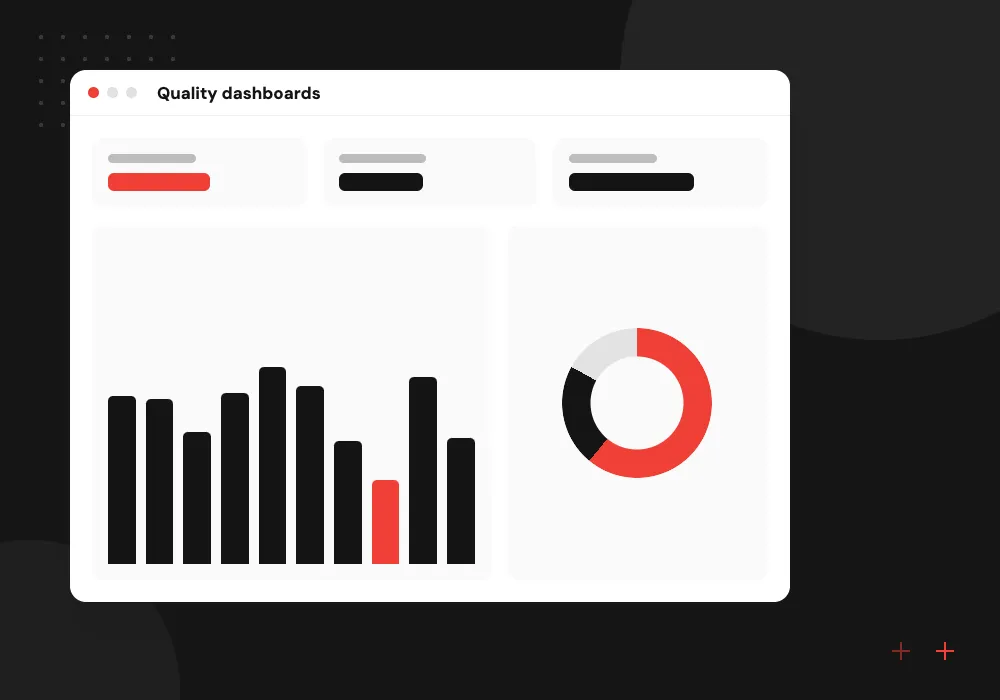
Quality dashboards
Scores for groundedness, format errors, refusals and staff thumbs-down, charted by day and by prompt version.
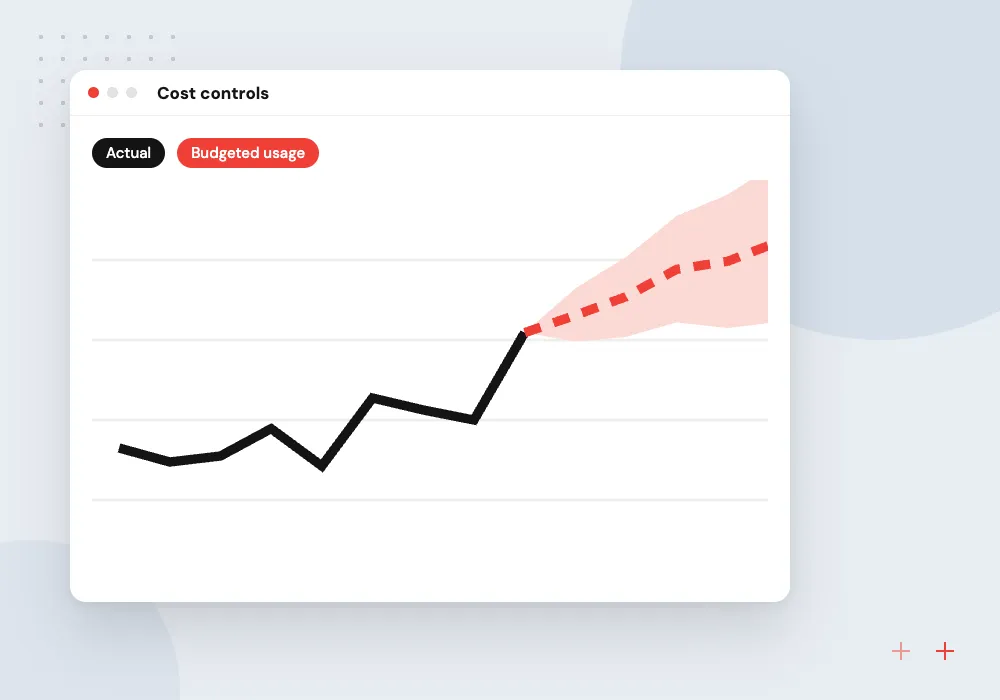
Cost controls
Token spend broken down by feature and customer, with quotas, rate limits and alerts when a loop or a heavy user drives a spike.
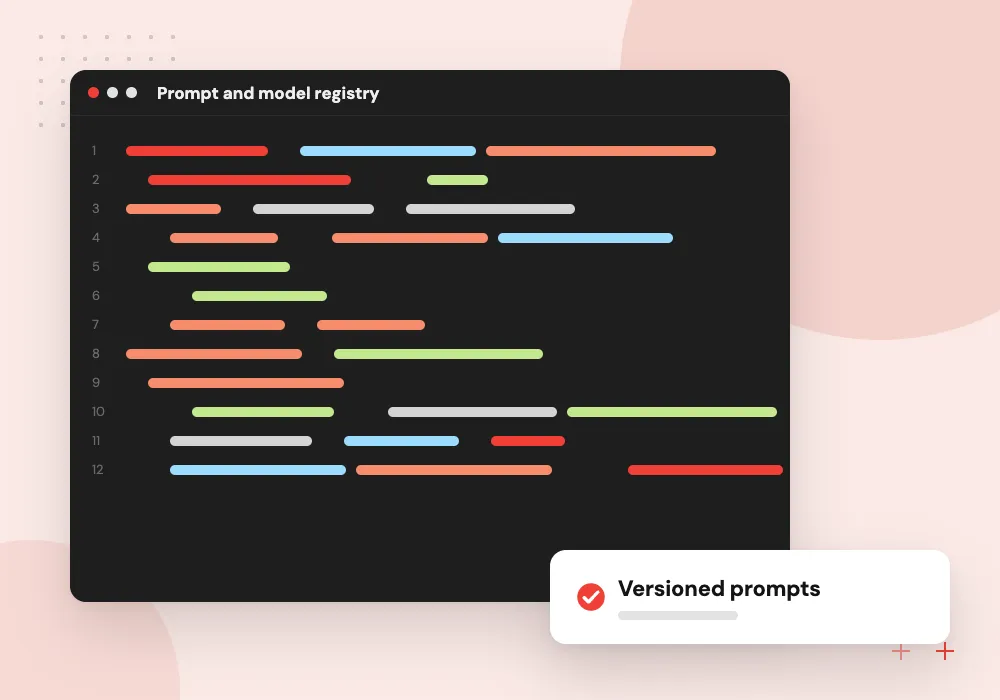
Prompt and model registry
Prompts, model settings and test results stored with versions, so you can see what changed last Tuesday and roll it back.
Quality review and feedback loop
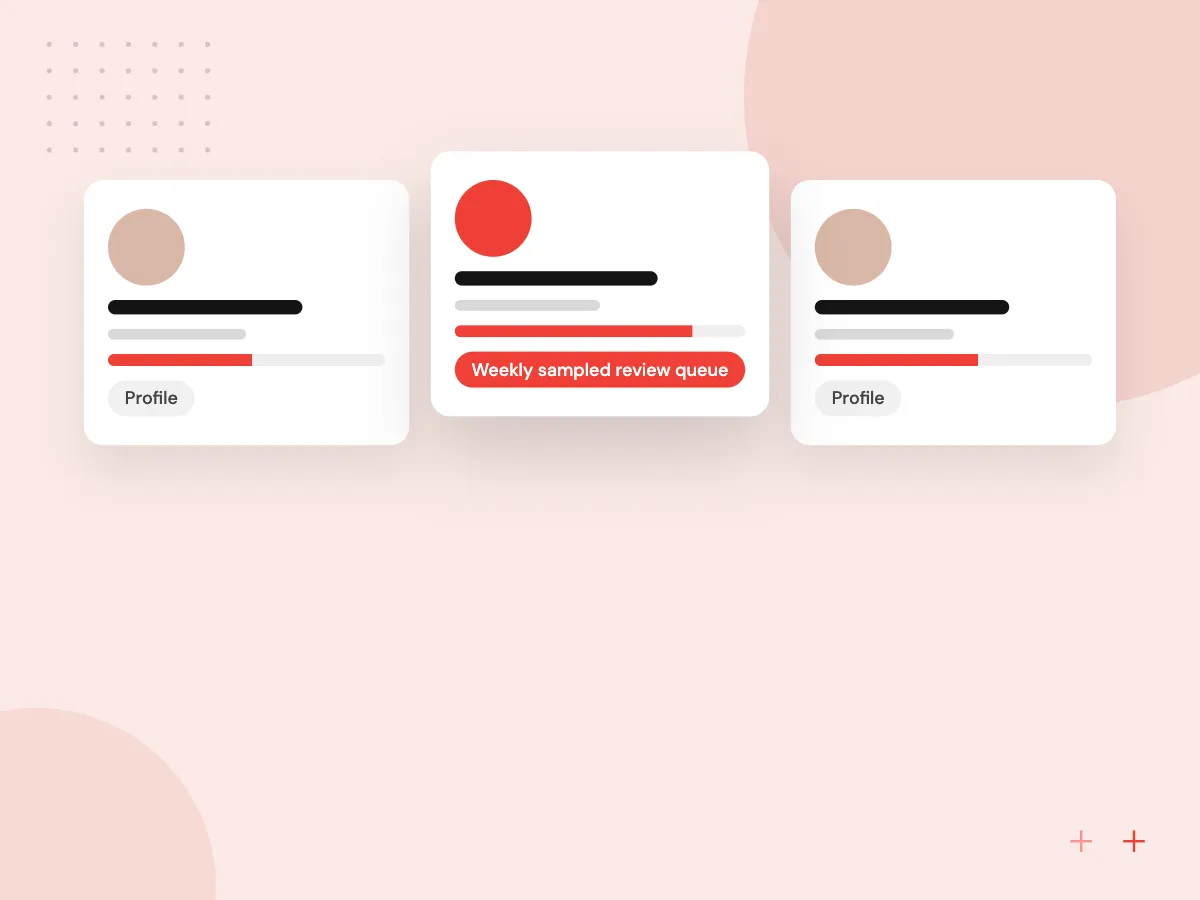
Live answers are sampled each week into a review queue. A subject expert on your side marks each one correct, partly correct or wrong and notes why. Wrong answers become test cases, and the monthly report shows which prompt or source document caused the most corrections.
What we do
- Weekly sampled review queue
- Simple grading rubric for reviewers
- Corrections turned into test cases
- Monthly quality report
- Grader agreement checks
Release pipeline for prompts and models
Prompts, model settings and retrieval rules live in version control next to the code. Each change runs the evaluation suite in CI, ships to a small share of traffic first, and is compared with the current version before full rollout.
What we do
- Prompts stored in version control
- Evaluation suite in CI
- Canary rollout by traffic share
- Automatic rollback triggers
- Change log for auditors

How we approach a project
Cost and abuse controls follow the OWASP guidance on unbounded consumption: per-user quotas, rate limits, caps on agent loops and alerts on unusual usage. Provider outages are handled with timeouts, retries and an approved fallback model.
The pipeline sits next to your DevOps setup: prompts in version control, tests in CI and staged rollouts. If your team also trains classic models, MLOps covers that side, and ongoing support can keep the stack watched after handover.
How we work
- Measure quality, not just uptime
- Every prompt change is versioned
- Cost visible per feature
Our Process
-

Audit the current setup
We review how your LLM features log, test and release today, and list the failures your team has already seen in production.
-

Instrument and baseline
Tracing and cost tracking go in first. A week or two of traffic gives the baseline for quality, latency and spend.
-

Add checks and alerts
Automatic quality checks, review queues and alert rules are wired to the people who will act on them, with thresholds agreed in writing.
-

Gate every release
Prompt, model and retrieval changes go through a test suite and a gradual rollout, with quick rollback to the last good version.
Why Aranv for LLMOps
We build LLM apps too
The same team writes LLM features and runs them, so monitoring covers the failure points we know from building retrieval and agent flows.
Your tools where possible
Traces and alerts go to the monitoring and paging tools your engineers already watch, instead of another dashboard nobody opens.
Thresholds agreed in writing
Quality, latency and spend limits are set with your product owner, so an alert means something and reaches someone who can act on it.
Cost tracked from day one
Token spend is reported by feature and customer from the first week, which makes pricing and model choices easier to defend.
Planning LLMOps?
Book a 30-minute conversation with the team that would build it.
LLMOps FAQs
-
What is the difference between LLMOps and MLOps?
MLOps manages models you train, with a focus on data pipelines, retraining and drift. LLMOps manages applications built on large language models, which you often do not train at all, so the focus moves to prompts, retrieved context, tool calls, answer quality and token cost. Many teams need both.
-
What should LLM monitoring track?
At minimum: latency, errors, token use and cost per request; quality signals such as groundedness, format validity and user feedback; and safety signals such as refusals or blocked outputs. Traces should show each step, so a bad answer can be followed back to its cause.
-
Do we need a dedicated LLM observability tool?
Not always. If you already run a monitoring stack, OpenTelemetry traces can feed it. A dedicated tool helps when product or support staff need to read conversations, label them and build test sets without engineering help. We recommend based on who will use it day to day.
-
How do you check answer quality without reading every conversation?
Automatic checks score every response on things a script can judge, such as valid format or citations that exist. A model-based grader handles softer criteria, and a small weekly sample goes to a person who keeps the grader honest.
-
Can LLMOps reduce our model costs?
Often. Tracing shows where tokens go: long system prompts, repeated context, retries or agent loops. Fixes include caching, shorter prompts, routing simple requests to a smaller model and capping loops. We measure spend before and after each change rather than promising a figure.

Let’s talk about your next step
Contact Aranv to discuss your workflow, current tools, and goals. Meet with our team or send an inquiry.
Book a meeting with our team
Choose an available date and time for a 30-minute conversation about your project.
Tell us about your project
Share a few details so we can discuss a useful next step.
Prefer email? sales@aranv.com