


Tableau or Power BI: what to check
Aranv’s answer on Power BI vs Tableau: Power BI usually fits companies that run on Microsoft 365, Azure and Excel, while Tableau fits teams that value visual exploration, author on Macs or work closely with Salesforce. Both handle dashboards, sharing and governed data well.
Licensing and sharing. Both tools license report authors and viewers differently, and the sharing model shapes total cost more than the authoring license. Map who creates content, who only reads it and whether outside users need access before comparing quotes. Our business intelligence page explains how we plan BI rollouts.
The data underneath. Either tool works best on a clean warehouse or semantic model rather than direct links to dozens of spreadsheets. Data engineering builds those pipelines, and teams storing data in Snowflake can read about Snowflake consulting.
Where the two tools differ
Power BI and Tableau at a glance
- 01 Ecosystem Power BI sits within Microsoft Fabric and 365; Tableau is part of Salesforce.
- 02 Authoring Power BI Desktop runs on Windows; Tableau Desktop installs on Windows and Mac.
- 03 Data modeling Power BI uses Power Query and DAX; Tableau uses relationships and calculated fields.
- 04 Hosting Both offer cloud services; Power BI Report Server and Tableau Server run on-premises.
Both are mature tools. The better one is the one that suits your data, your people and your existing licenses.
Power BI vs Tableau: four deciding points
A BI tool comparison only helps when it is anchored in how your company already works.
Existing software stack
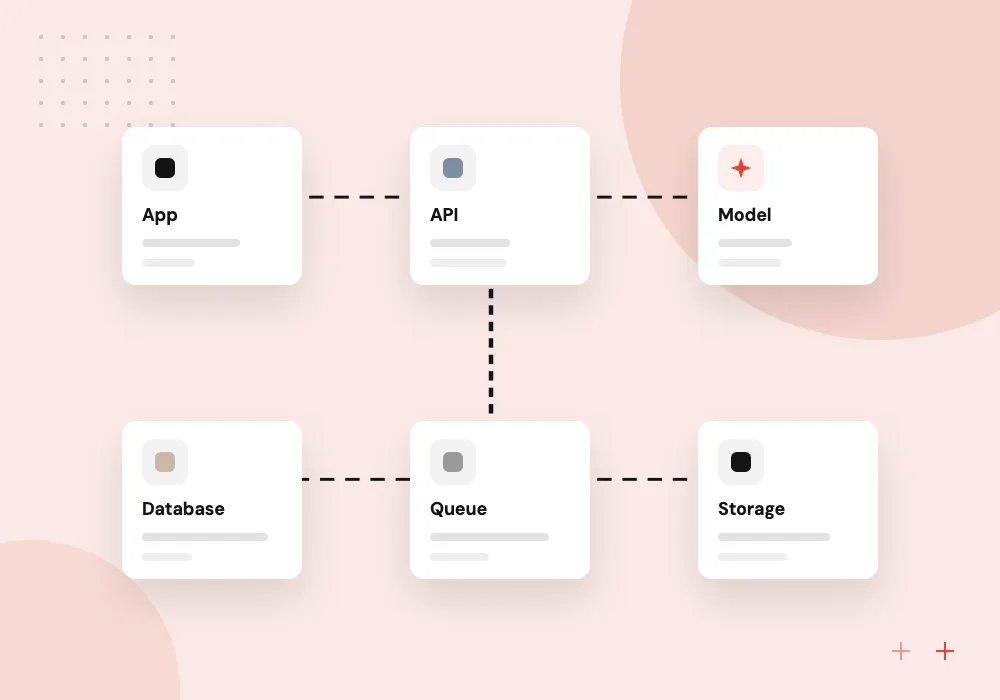
Companies on Microsoft 365, Teams and Azure get native sharing and sign-in with Power BI. Salesforce-centered companies find closer links in Tableau.

Who builds reports
Excel-heavy analysts often pick up Power BI quickly. People who explore data visually and design rich views often prefer Tableau’s drag-and-drop canvas.
Data modeling approach
Power BI favors a star-schema semantic model with DAX measures. Tableau joins sources through relationships and calculated fields, often on top of a warehouse.

AI and plain-language questions
Both ship features that answer questions in plain language and summarize trends. Their answers are only as good as the data model and field names underneath.
Where Power BI is strong
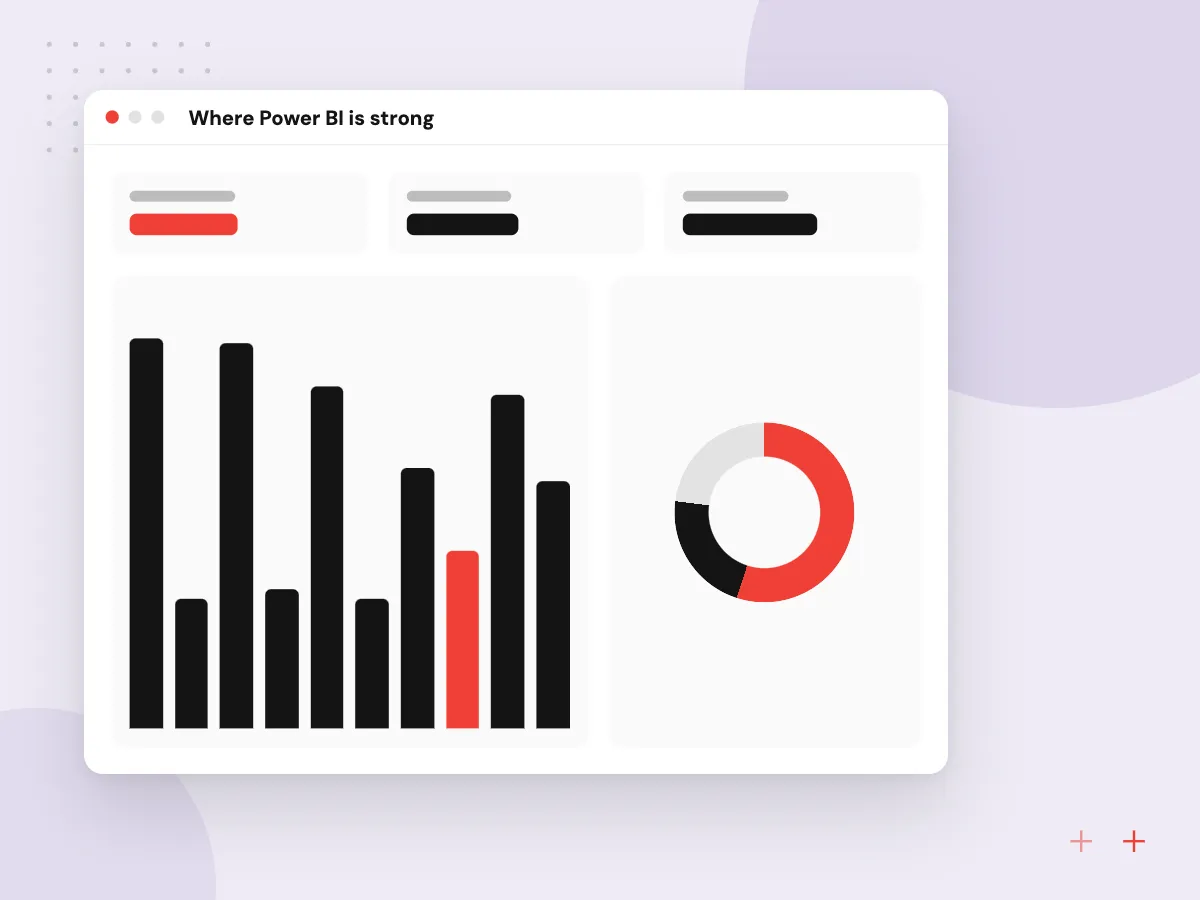
Power BI fits naturally into Microsoft 365: reports appear in Teams, data comes from Excel and SharePoint, and sign-in uses Microsoft Entra ID. Semantic models with DAX measures give finance and operations one shared definition of each number.
What we do
- Sharing in Teams and SharePoint
- Power Query for data preparation
- DAX measures in a semantic model
- Row-level security by role
- Monthly Desktop releases
Where Tableau is strong
Tableau is built for visual exploration: analysts drag fields onto a canvas and follow questions as they arise. Authors can work on Windows or Mac, publish to Tableau Cloud or Tableau Server, and connect closely with Salesforce data.
What we do
- Drag-and-drop visual analysis
- Desktop on Windows and Mac
- Tableau Cloud or Tableau Server
- Tableau Prep for data cleanup
- Close links with Salesforce

How we approach a project
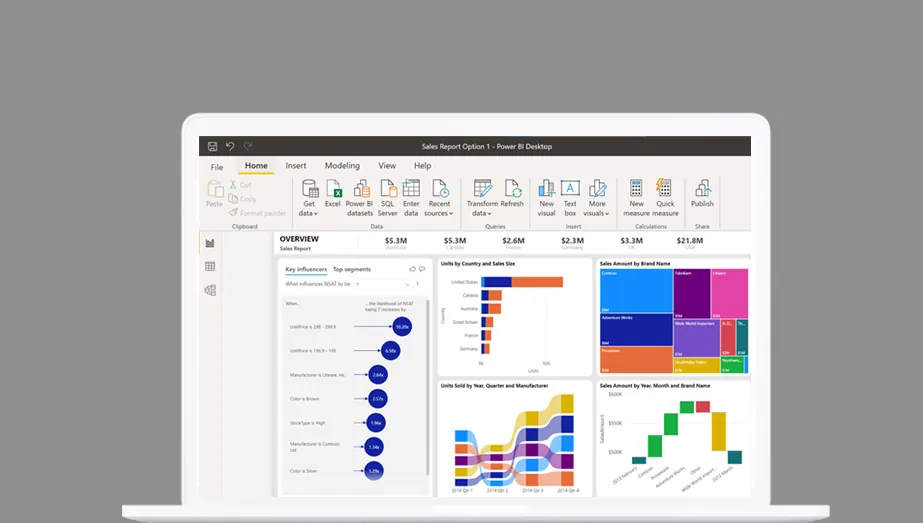
If you choose Power BI. Our Power BI consulting covers semantic models, row-level security, refresh schedules and report design. Microsoft releases Power BI Desktop every month, so we plan regular updates for report authors.
When neither fits. If many external viewers need a few charts inside your own portal, per-viewer licenses may not make sense. Dashboard development can build those views straight into your product instead.
How we work
- Start from your data sources
- Test with reports people use
- Model data once, reuse it everywhere
Our Process
-

List data sources and users
Note every source system, plus how many people create reports and how many only view them.
-

Pick three real reports
Choose reports people use today, including one messy one, as the test set.
-

Build them in both
Use trial accounts to rebuild the three reports and record the effort and the result.
-

Compare full ownership
Weigh licenses, hosting, training, governance work and the skills you can hire.
How Aranv helps you choose
Open about our practice
We offer Power BI consulting and say so. If your reports, users and systems point to Tableau, we tell you, and the data work underneath stays useful either way.
Your reports as the test
We rebuild a small set of your real reports as the comparison, so the decision rests on your data rather than vendor demos.
Model before visuals
We design warehouse tables and measures first, which makes any BI tool faster to build on and easier to govern.
AI features prepared properly
Before switching on plain-language features, we name fields clearly, define measures and test common questions against answers we already know.
Ready to act on this guide?
Ask our team in a 30-minute conversation.
Or see how we build it: Explore all services
Power BI vs Tableau FAQs
-
Is Power BI or Tableau better?
Neither wins everywhere. Power BI tends to suit companies standardized on Microsoft tools and analysts who live in Excel. Tableau tends to suit teams that explore data visually, author on Macs or run on Salesforce. Testing both on your own reports settles it faster than feature lists.
-
Can Power BI run on a Mac?
Power BI Desktop, the main authoring tool, needs Windows 10 or later, or Windows Server 2016 or later. Mac users can view and edit many reports in the Power BI service in a browser, or run Windows in a virtual machine. Tableau Desktop installs on both Windows and Mac.
-
Which is easier to learn, Tableau or Power BI?
For people comfortable with Excel formulas and pivot tables, Power BI often feels familiar, though DAX takes time to master. Tableau’s canvas is quick for visual exploration, while advanced calculations take practice. A training plan matters more than the tool.
-
Can we self-host Power BI or Tableau?
Yes, both. Microsoft offers Power BI Report Server for on-premises use, and Tableau Server runs on your own Windows or Linux servers. The cloud services need less upkeep, so self-hosting is usually chosen for data residency or policy reasons.
-
How do AI features in Power BI and Tableau work?
Both offer assistants that answer plain-language questions, suggest visuals or summarize changes, with availability tied to licenses and admin settings. They depend on clear table names, defined measures and trusted data, so we prepare the semantic model and descriptions before switching them on.
-
Can we move reports from Tableau to Power BI or the reverse?
Not automatically. Reports and calculations must be rebuilt, though the warehouse, the business logic and the report designs carry over. A move is a good moment to retire unused reports, so we review usage first.

Let’s talk about your next step
Contact Aranv to discuss your workflow, current tools, and goals. Meet with our team or send an inquiry.
Book a meeting with our team
Choose an available date and time for a 30-minute conversation about your project.
Tell us about your project
Share a few details so we can discuss a useful next step.
Prefer email? sales@aranv.com