


What dashboard development services include
Aranv offers dashboard development services for US small and midsize businesses: custom dashboards and reporting screens that pull CRM, ERP, accounting and operations data into one place, with agreed metric definitions, role-based views and alerts, built in Power BI or inside your own web app.
A dashboard is the last step of a data project, not the first. Before any chart, we connect the source systems, agree how each metric is calculated and build a reporting model that refreshes on a schedule. Our business intelligence page covers the wider reporting setup, and data engineering handles pipelines and warehouses when volumes call for them.
The tool depends on who is looking. Internal reporting often fits Power BI, which our Power BI consulting team builds and maintains. Dashboards inside your own product or portal are usually custom code with a charting library, so they match your design and permission rules.
From exported spreadsheets to a live dashboard
How a dashboard earns trust
- 01 Agree the questions We list the decisions each role makes weekly and the numbers behind them.
- 02 Define every metric Revenue, margin and on-time rate each get one written definition and source.
- 03 Model and load data Pipelines pull from each system on a schedule into a clean reporting model.
- 04 Design, test, release Charts are checked against known totals before managers start relying on them.
Most dashboard problems are definition problems. Two reports that disagree on revenue will not be used, however good they look.
Custom dashboard development by audience
A useful dashboard answers a known question for a named person, at the pace that person works.
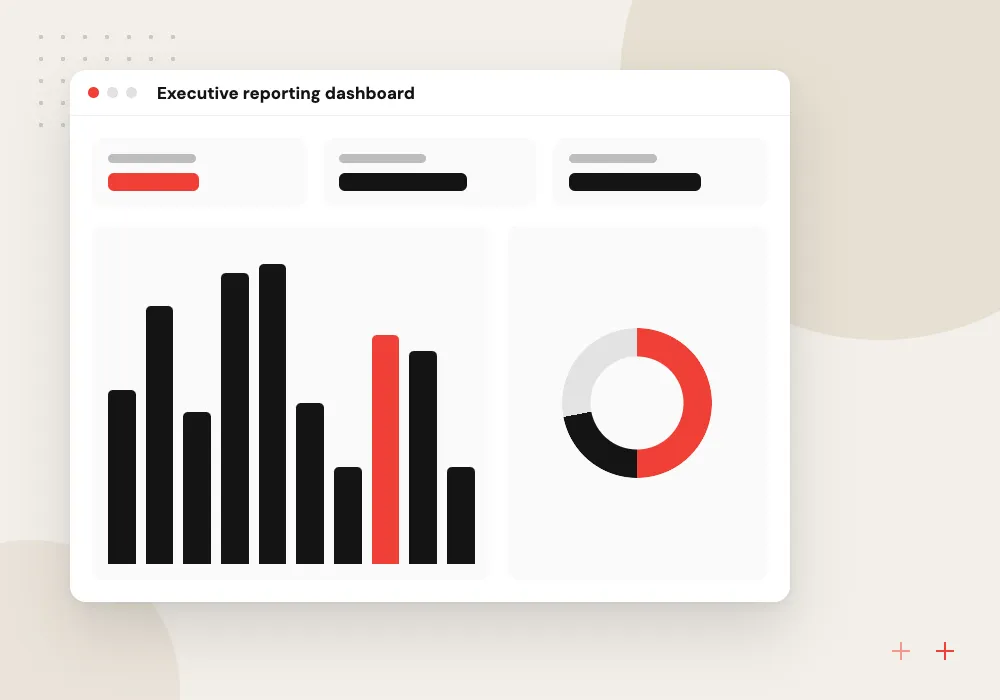
Executive reporting dashboard
Revenue, margin, cash and pipeline on one page for owners and leadership, with drill-down to the customer, product or region behind each number.
Operations dashboards
Orders, production, stock, service tickets or job status refreshed through the day, so supervisors spot a backlog before customers feel it.
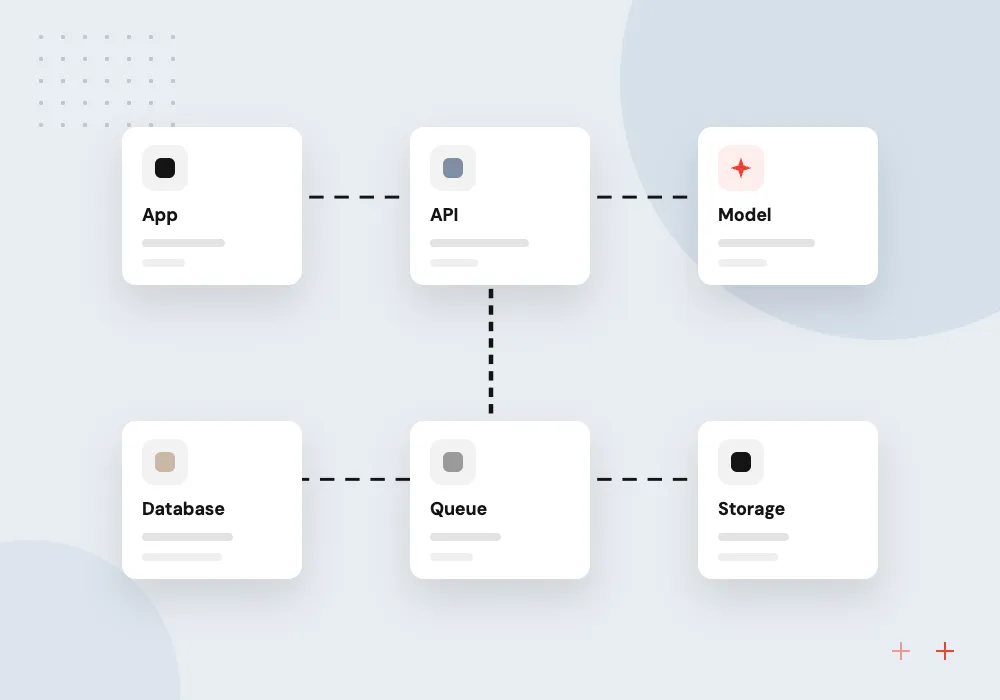
Customer-facing dashboards
Usage, spend or performance reports embedded in your product or client portal, filtered so each customer sees only their own figures.
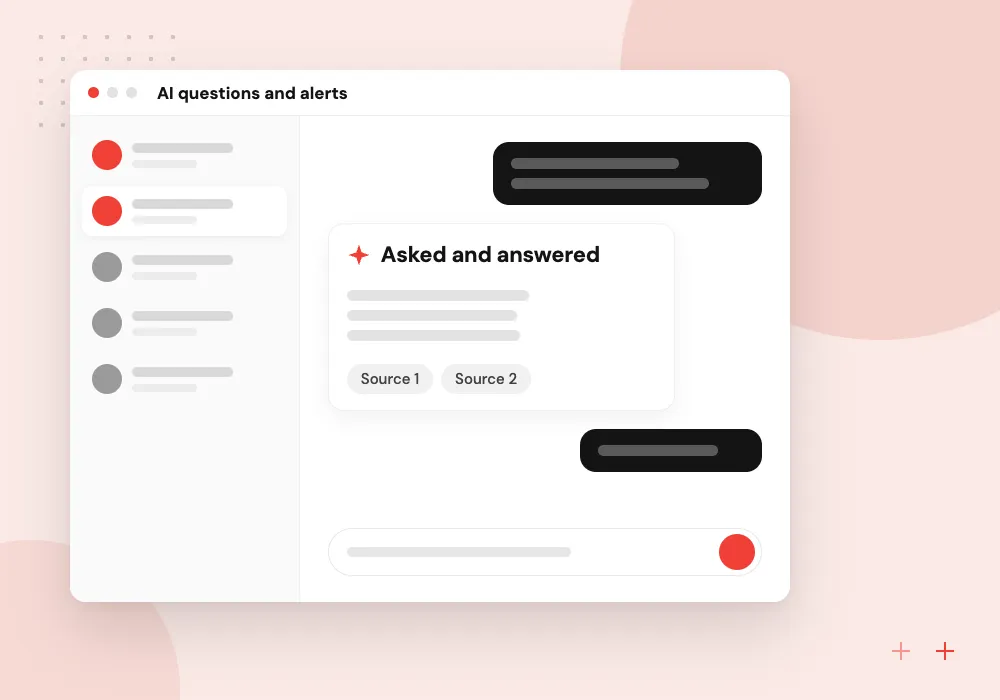
AI questions and alerts
Managers type a question in plain English and get a chart built from approved metrics, while anomaly alerts point out numbers that moved more than usual.
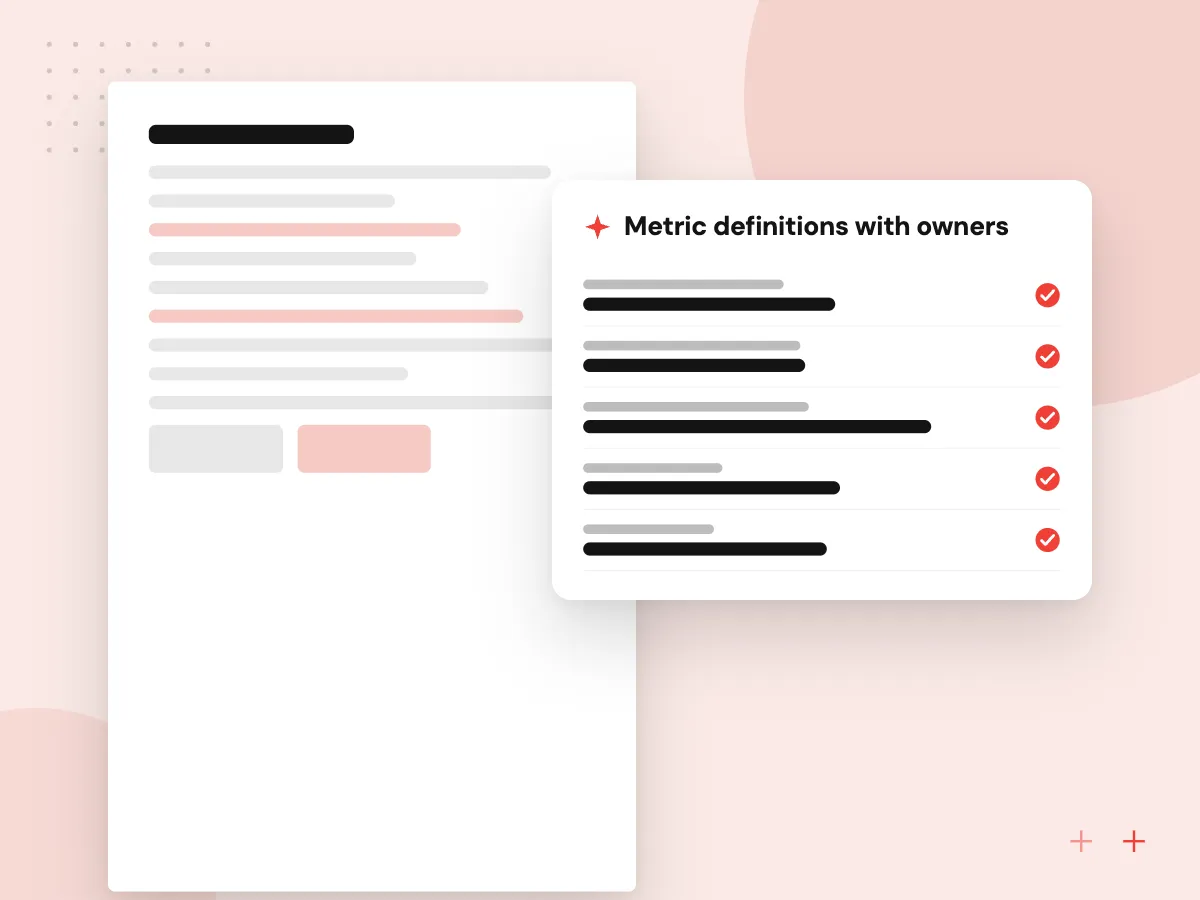
Reporting dashboards built on a metric dictionary
Every number on the dashboard comes from a written definition that finance or operations has approved: whether revenue is booked at invoice or at payment, how late an order can ship and still count as on time, which customers are active. We build those definitions once in a shared model, so every chart and export agrees with the others.
What we do
- Metric definitions with owners
- Shared reporting model
- Reconciliation against accounting
- Row-level security by role
- Scheduled refresh and alerts
AI on top of trusted numbers
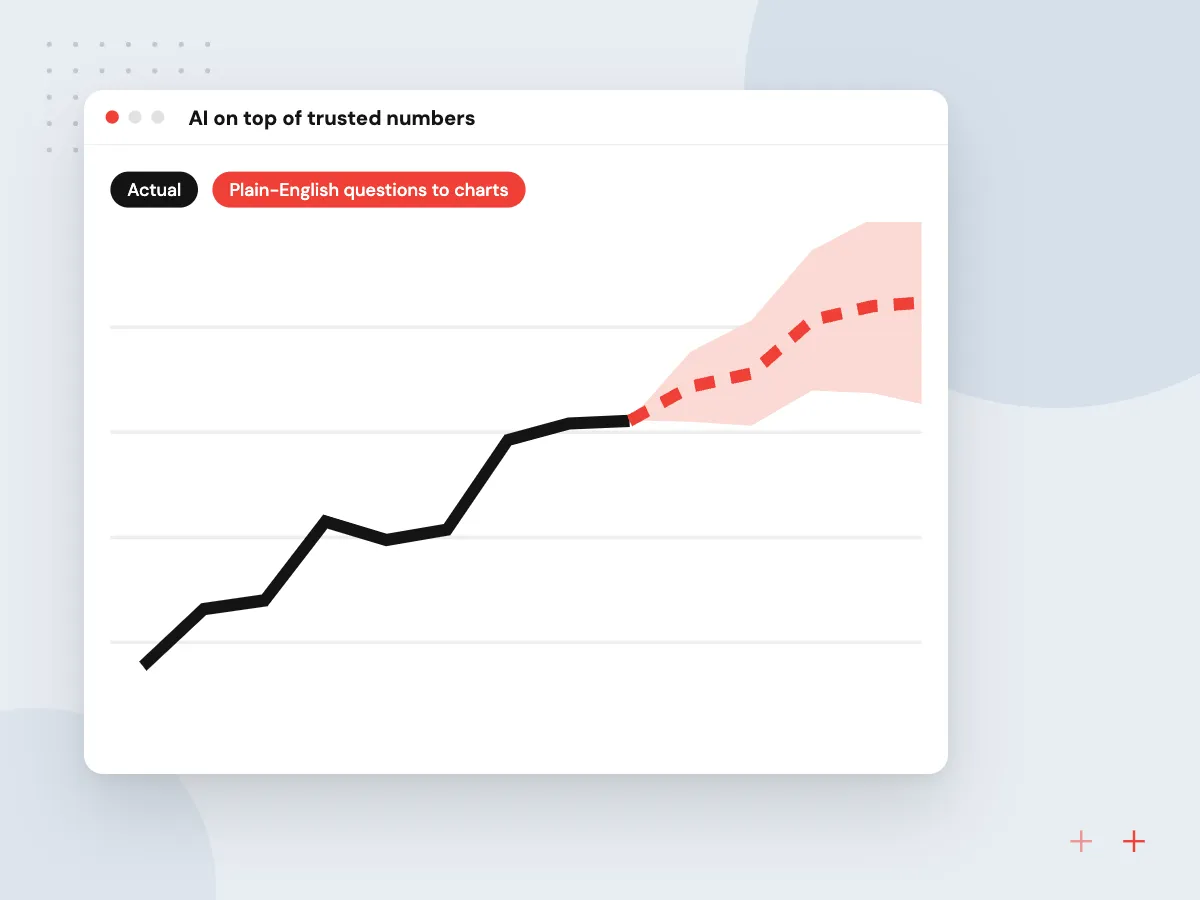
Once the metrics are agreed, AI can make them easier to use. Managers ask questions in plain English and get a chart with the query shown. Anomaly detection highlights a cost line or region that moved unusually, and a weekly written summary explains the biggest changes for people who rarely open dashboards.
What we do
- Plain-English questions to charts
- Query shown with every answer
- Anomaly alerts by email or Teams
- Weekly written summaries
- Forecast lines on key metrics
How we approach a project
Design rules keep a reporting dashboard readable: a few key numbers at the top, the same color for the same thing everywhere, and direct labels instead of legends where possible. We follow WCAG 2.2 guidance on contrast and text alternatives, so lines and bars stay readable for people with low vision or color blindness.
AI features sit on top of trusted numbers. Plain-English questions become queries against approved metrics only, and AI anomaly detection can flag unusual moves in sales, costs or traffic. When you want forward-looking figures, predictive analytics adds forecasts to the same views.
How we work
- One definition for every metric
- Fewer charts, clearer decisions
- Numbers reconciled before release
Our Process
-

Interview the readers
We meet each person who will use the dashboard and write down the decisions it should support.
-

Write the metric dictionary
Every number gets a definition, formula, source system and owner, signed off by finance or operations.
-

Build the data model
Pipelines load and clean the data, and totals are reconciled against your accounting and operational reports.
-

Release and prune
Views go live by role; a few weeks later we drop charts nobody opens and refine the ones people use.
Why Aranv for dashboards
Definitions before design
We get one signed-off definition for each metric before building charts, which ends the meeting where two reports argue about revenue.
Reconciled to your books
Dashboard totals are checked against accounting and operational reports before release, and the reconciliation queries are kept for later checks.
Right tool for the reader
We use Power BI where it fits and custom code where it does not, rather than forcing every dashboard into one product.
Watched after launch
Source systems rename fields and change APIs. We monitor scheduled refreshes and repair broken pipelines so the figures stay current.
Planning Dashboard Development?
Book a 30-minute conversation with the team that would build it.
Dashboard project questions
-
What affects the price of custom dashboard development?
The number of source systems, how clean their data is, the count of metrics and views, refresh frequency, and whether dashboards are internal or embedded in your product. Data preparation is often the bigger share of the work. Estimates follow a short discovery and come in phases.
-
Should we use Power BI or build a custom dashboard?
Power BI suits internal reporting when your team uses Microsoft 365 and wants self-service analysis. A custom build suits reports embedded in your product or portal, unusual interactions, or cases where licenses for outside viewers would cost too much. Many businesses use both.
-
Why do our reports show different numbers for the same metric?
Usually each report calculates it differently, or pulls from another system or date range. The fix is one written definition per metric, built once in a shared model, with every dashboard pointed at that model.
-
How often can a dashboard refresh?
Anywhere from daily to every few minutes, depending on the source systems’ APIs, data volume and hosting. Management views often refresh daily or hourly, while boards tracking live orders or tickets refresh more often.
-
Can AI answer questions about our dashboard data?
Yes, within limits. We connect the AI to a governed set of metrics, so it builds queries from approved definitions instead of raw tables, shows the query behind each answer, and declines questions outside the data it can see.

Let’s talk about your next step
Contact Aranv to discuss your workflow, current tools, and goals. Meet with our team or send an inquiry.
Book a meeting with our team
Choose an available date and time for a 30-minute conversation about your project.
Tell us about your project
Share a few details so we can discuss a useful next step.
Prefer email? sales@aranv.com